


Trading Cryptocurrencies with the help of Technical Analysis can be very powerful and rewarding. History shows that if you cut your losses short and let your winners run, you'll make fortune from trading, and Technical Analysis helps you do just that. It allow you to Identify market direction, Trend and Stop Loss.
Today we're going to apply Technical Analysis and indicators to the chart of Cardano and see where it's headed. So, let's dive right in.
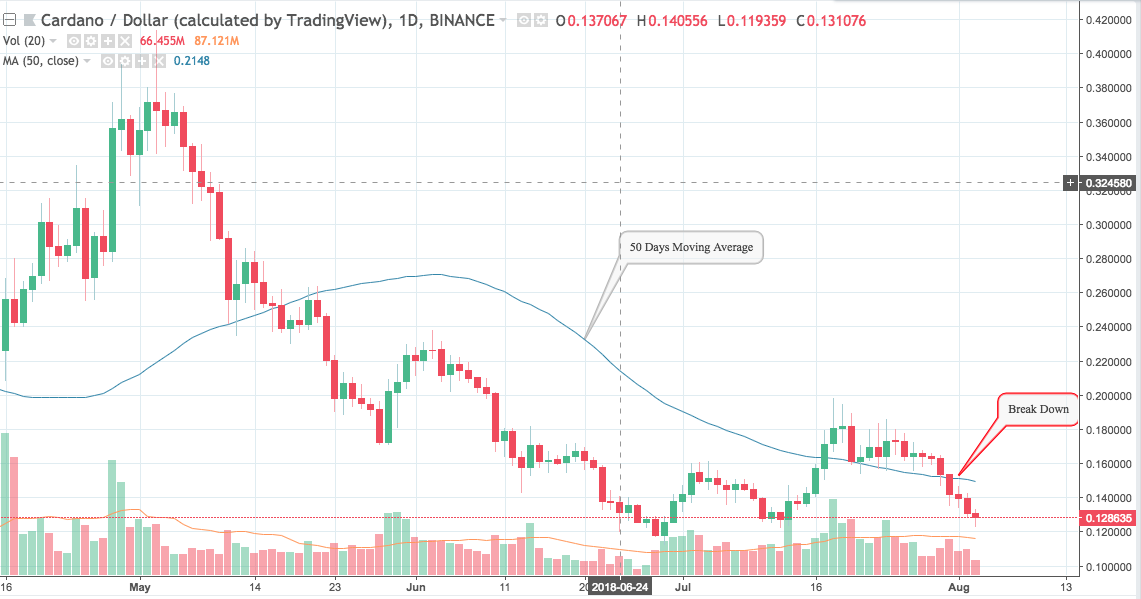
50 Day moving average indicates a small fresh short position on a reversal
Moving Average (MA) in simple term is just average of any subset of numbers. 50 Days moving average is one of the most effective and used moving average. It's calculated at any point in chart by summing past 50 days of price and then dividing it by 50.
Applying 50 days Simple Moving Average to Cardano chart shows that Cardano is looking weak, as It has broken down 50 days MA. Traders should aim for a small short trade if it bounces back to 50 day MA level of around 0.14 in next week, with a target of 0.10 and a StopLoss of 0.16. The Risk reward for this trade is 1:2.
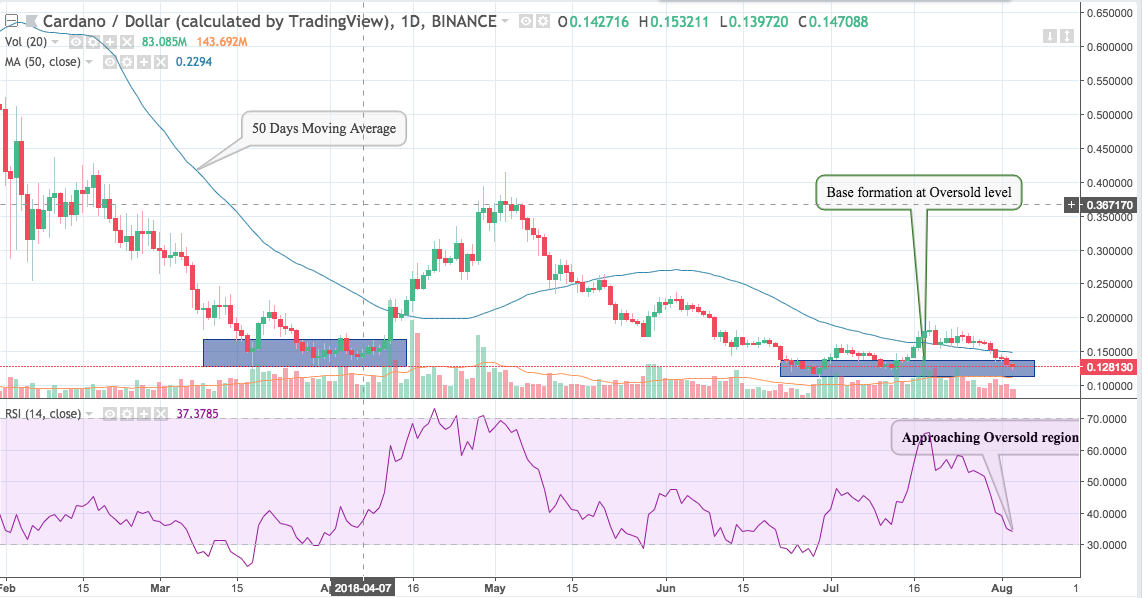
RSI approaching oversold, showing signs of a big up move
Relative Strength Index (RSI) is an important indicator that measures speed and change of price movements. It's value ranges between zero and 100. Value around 30 and below is considered oversold region and around 70 and above considered overbought regions.
Applying RSI to Cardano chart shows that Cardano is hovering around oversold regions of 30, and approaching quicking to the extreme oversold region below 30. We can see from the chart that It has bounced back sharply in the past when it approached extreme oversold regions in mid-March and mid-June.
Moreover, Right now it's also forming a good base with consolidation, like it did in mid-March at oversold levels. Hence, This is a very good sign that Cardano can have a big upmove in the coming month, if it consolidates for next 1 week and doesn't break it's long term support of 0.10. Traders should consider going long once it goes above 50 day moving average at 0.14 and approach 0.15. StopLoss should be 0.10 and Target should be 0.35, close to previous high. Risk-reward for this trade is 1:6.
Disclaimer: Views expressed here are those of the author and aren’t an investment or trading advice. Trading involves risk and so do your due diligence before making a trading decision.

